Inventory Forecasting
& Restock Alerts
Demand forecasting models that predict when to restock, optimize FBA storage fees, and prevent costly stockouts that tank your rankings.
Demand Planning
What I Forecast
Inventory management isn't just counting stock — it's predicting demand, timing orders, and keeping capital working. Here's what I handle.
Demand Forecasting
Predictive models based on historical sales, seasonality, and trend analysis — not simple averages.
- Seasonal demand curve modeling
- Year-over-year trend adjustment
- Promotional spike forecasting
Restock Alerts
Automated alerts when stock approaches reorder point, well before you hit zero.
- Dynamic reorder point calculation
- Lead-time-aware alert triggers
- Multi-channel stock consideration
FBA Storage Optimization
Keep FBA costs low by right-sizing inventory levels and avoiding long-term storage fees.
- Long-term storage fee avoidance
- Aged inventory removal recommendations
- IPI score monitoring & optimization
Multi-Channel Sync
Keep stock levels accurate and synchronized across every sales channel in real time.
- Cross-channel inventory sync
- Oversell prevention logic
- Channel-specific buffer allocation
Safety Stock
ABC-tiered safety stock so your best sellers are always available while slow movers stay lean.
- Revenue-weighted ABC classification
- Generous buffers for top 20% sellers
- Lean stock on slow-moving C-items
Supplier Lead Time
Factor in real supplier lead times, variability, and shipping delays into every forecast.
- Supplier-specific lead time tracking
- Delay variability analysis
- Automated PO timing recommendations
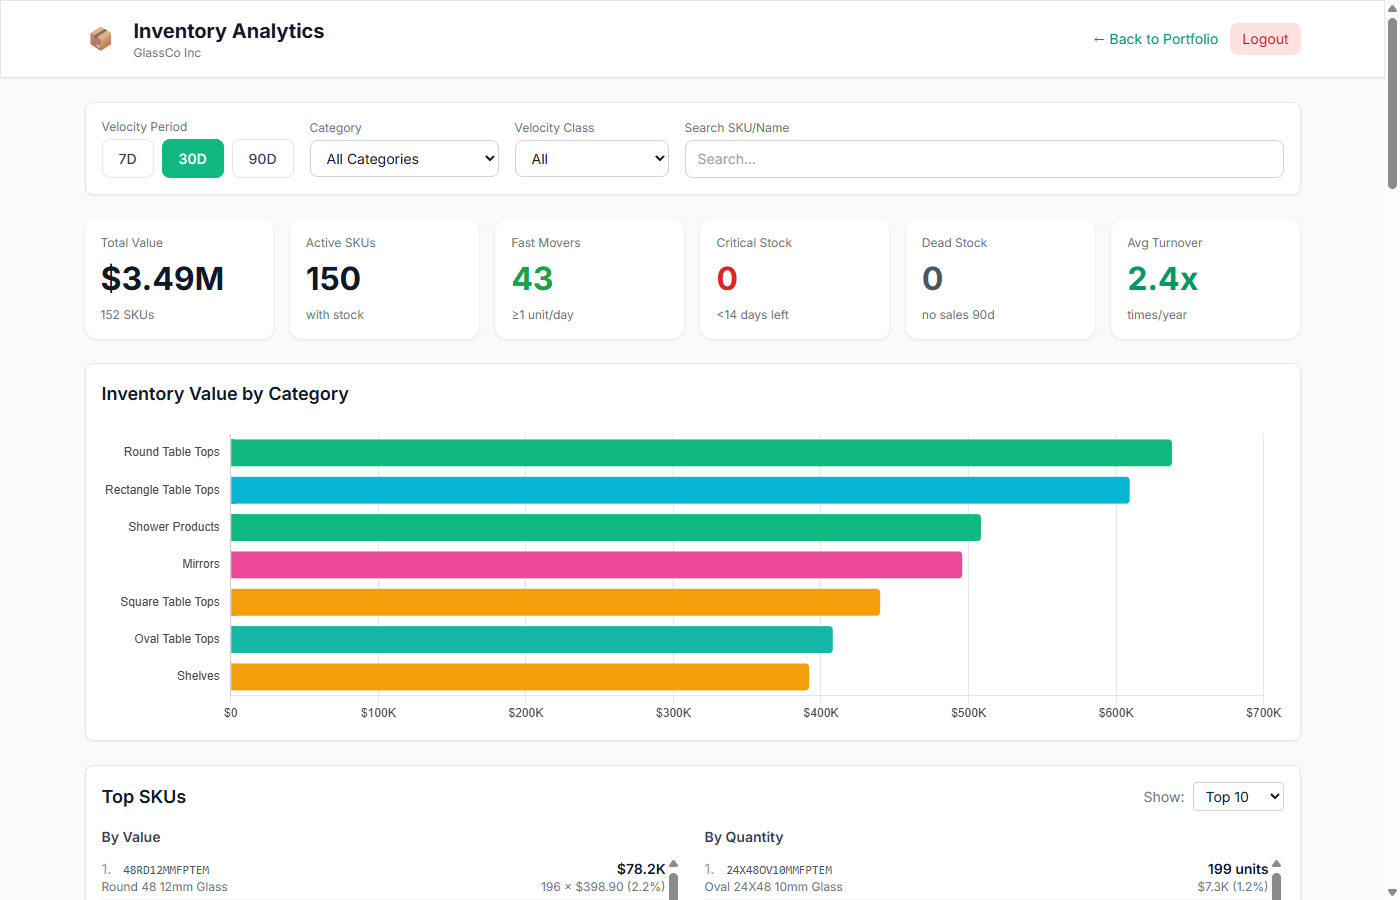
Inventory Forecast Preview
Deliverables
What You Get
Demand Forecasting Models
Historical velocity analysis with seasonal adjustments to predict future demand per SKU.
Restock Alert Notifications
Automated email or Slack alerts when inventory dips below your configurable threshold.
Days-of-Supply Tracking
Know exactly how many days of inventory you have left at current sell-through rates.
FBA Storage Fee Optimization
Recommendations to minimize long-term storage fees and avoid aged inventory surcharges.
Lead Time Calculations
Factor in supplier lead times and shipping windows so you order at the right moment.
Visual Inventory Dashboards
At-a-glance dashboards showing stock levels, velocity trends, and upcoming restock dates.
Scope & Pricing
Every Project Is Different
I scope every engagement individually based on your data, goals, and timeline. No cookie-cutter packages — just a solution built around what you actually need.
Data Volume
Number of SKUs, pages, or data points to process drives the scope of the project.
Delivery Format
Raw CSV, live dashboard, API integration, or automated reporting — each has different complexity.
Ongoing Support
One-time delivery versus ongoing monitoring, maintenance, and iteration on results.
Process
How It Works
Analyze
Review 12-24 months of sales history, identify seasonality patterns, and classify products by velocity (ABC analysis).
Model
Build demand forecasting models per SKU — incorporating seasonality, trend, and promotional calendar inputs.
Automate
Set up automated reorder alerts with calculated safety stock and lead time buffers. Dashboard shows days-of-stock remaining per SKU.
Optimize
Monthly forecast accuracy reviews. Adjust models for new products, demand shifts, and supply chain changes. Reduce both stockouts and overstock over time.
Deep Dive
Expert Insight
Safety Stock: The Insurance You Need
Safety stock = Z-score × √(Lead time) × Standard deviation of daily demand. In plain English: the more variable your demand and the longer your lead time, the more buffer you need. A product that sells 10±2 units/day with 7-day lead time needs far less safety stock than one that sells 10±8 units/day with 30-day lead time.
The Z-score controls your service level: 1.65 for 95% in-stock rate, 2.33 for 99%. Going from 95% to 99% nearly doubles your safety stock — the question is whether that extra 4% in-stock rate justifies the additional inventory cost.
Storage Cost Optimization: The Hidden Margin Killer
Amazon FBA charges per-cubic-foot monthly storage fees that jump significantly during Q4 (October–December). Long-term storage fees escalate sharply for items sitting 271–365 days. For oversized products like glass table tops, these fees can exceed the product's margin entirely. The forecast model needs to account for storage economics — sometimes it's cheaper to risk a brief stockout than to carry 6 months of slow-moving inventory through Q4.